Continuing with the Alex the Analyst YouTube series, I have completed my first Tableau dashboard. You can see it here: Click this Link.
It is a very intuitive software that allows data to be visualized and analyzed by those not well-versed in SQL and other intermediate to advanced analytical methods. Tableau allows data analysts to share their findings with a broader audience.
I have attached a screenshot of the dashboard below:
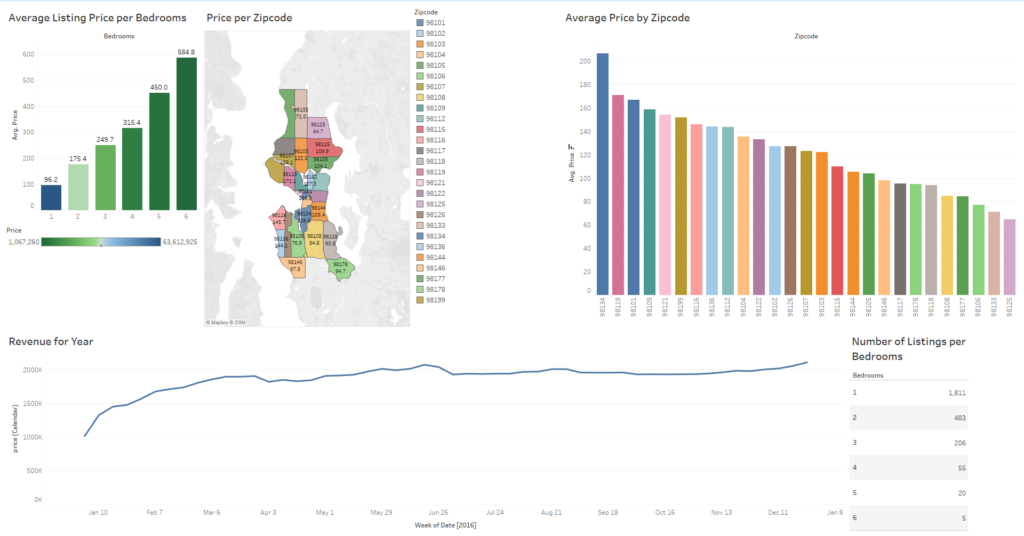
In this dashboard, I looked at 2016 data on the Airbnb listings in the Greater Seattle area. Each graphic considers a different variable to help paint a picture of the landscape of the various listings.
The first chart in the upper left serves to show the average price of the listings based on how many bedrooms are included in the listing. There is no surprise here in that there is a strong, consistent increase in average price with each additional bedroom.
The next chart shows a map of the different zipcodes in and around Seattle with the average cost of the Airbnb listings. This would be helpful for a market analysis of the different areas for investors looking to purchase a rental property in the area.
Following that is essentially the same information but in a bar chart showing the zipcodes by price in descending order.
The line chart that takes up the majority of the bottom of the dashboard shows the Revenue of the Airbnb listings overall for the Seattle area. This shows that early in the year, not as much money is generated and that there are a few bumps the correspond with Spring Break, the beginning and end of Summer Break as well as around Christmas.
Finally, the last chart shows the number of listings per number of bedrooms offered in said listing. It shows that there is a lot of competition in the one-bedroom offerings and that the competition decreases as the bedroom count increases.